
When I first read the statement above, many thoughts ran in my mind. Throughout our lives, we are so accustomed to data that subconsciously we interpret information according to our experience and what others tells us. A lot of conversation and discussion around us centers around data. But most of the time, we tend to neglect these bits of information that come our way.
There are two main types of data; quantitative and qualitative. Each has its own goals and usage. For example, quantitative data is normally used to understand user behaviour while qualitative data is used to find solutions for issues. Analytics tools such as Google Analytics and Adobe Analytics are some examples of quantitative data sources that show numerical data consisting of who, when, and where. Meanwhile, Google Forms, Survey Monkey, and focus group discussion are used to gather qualitative data sources that demonstrate the why or how.
Web Analytics
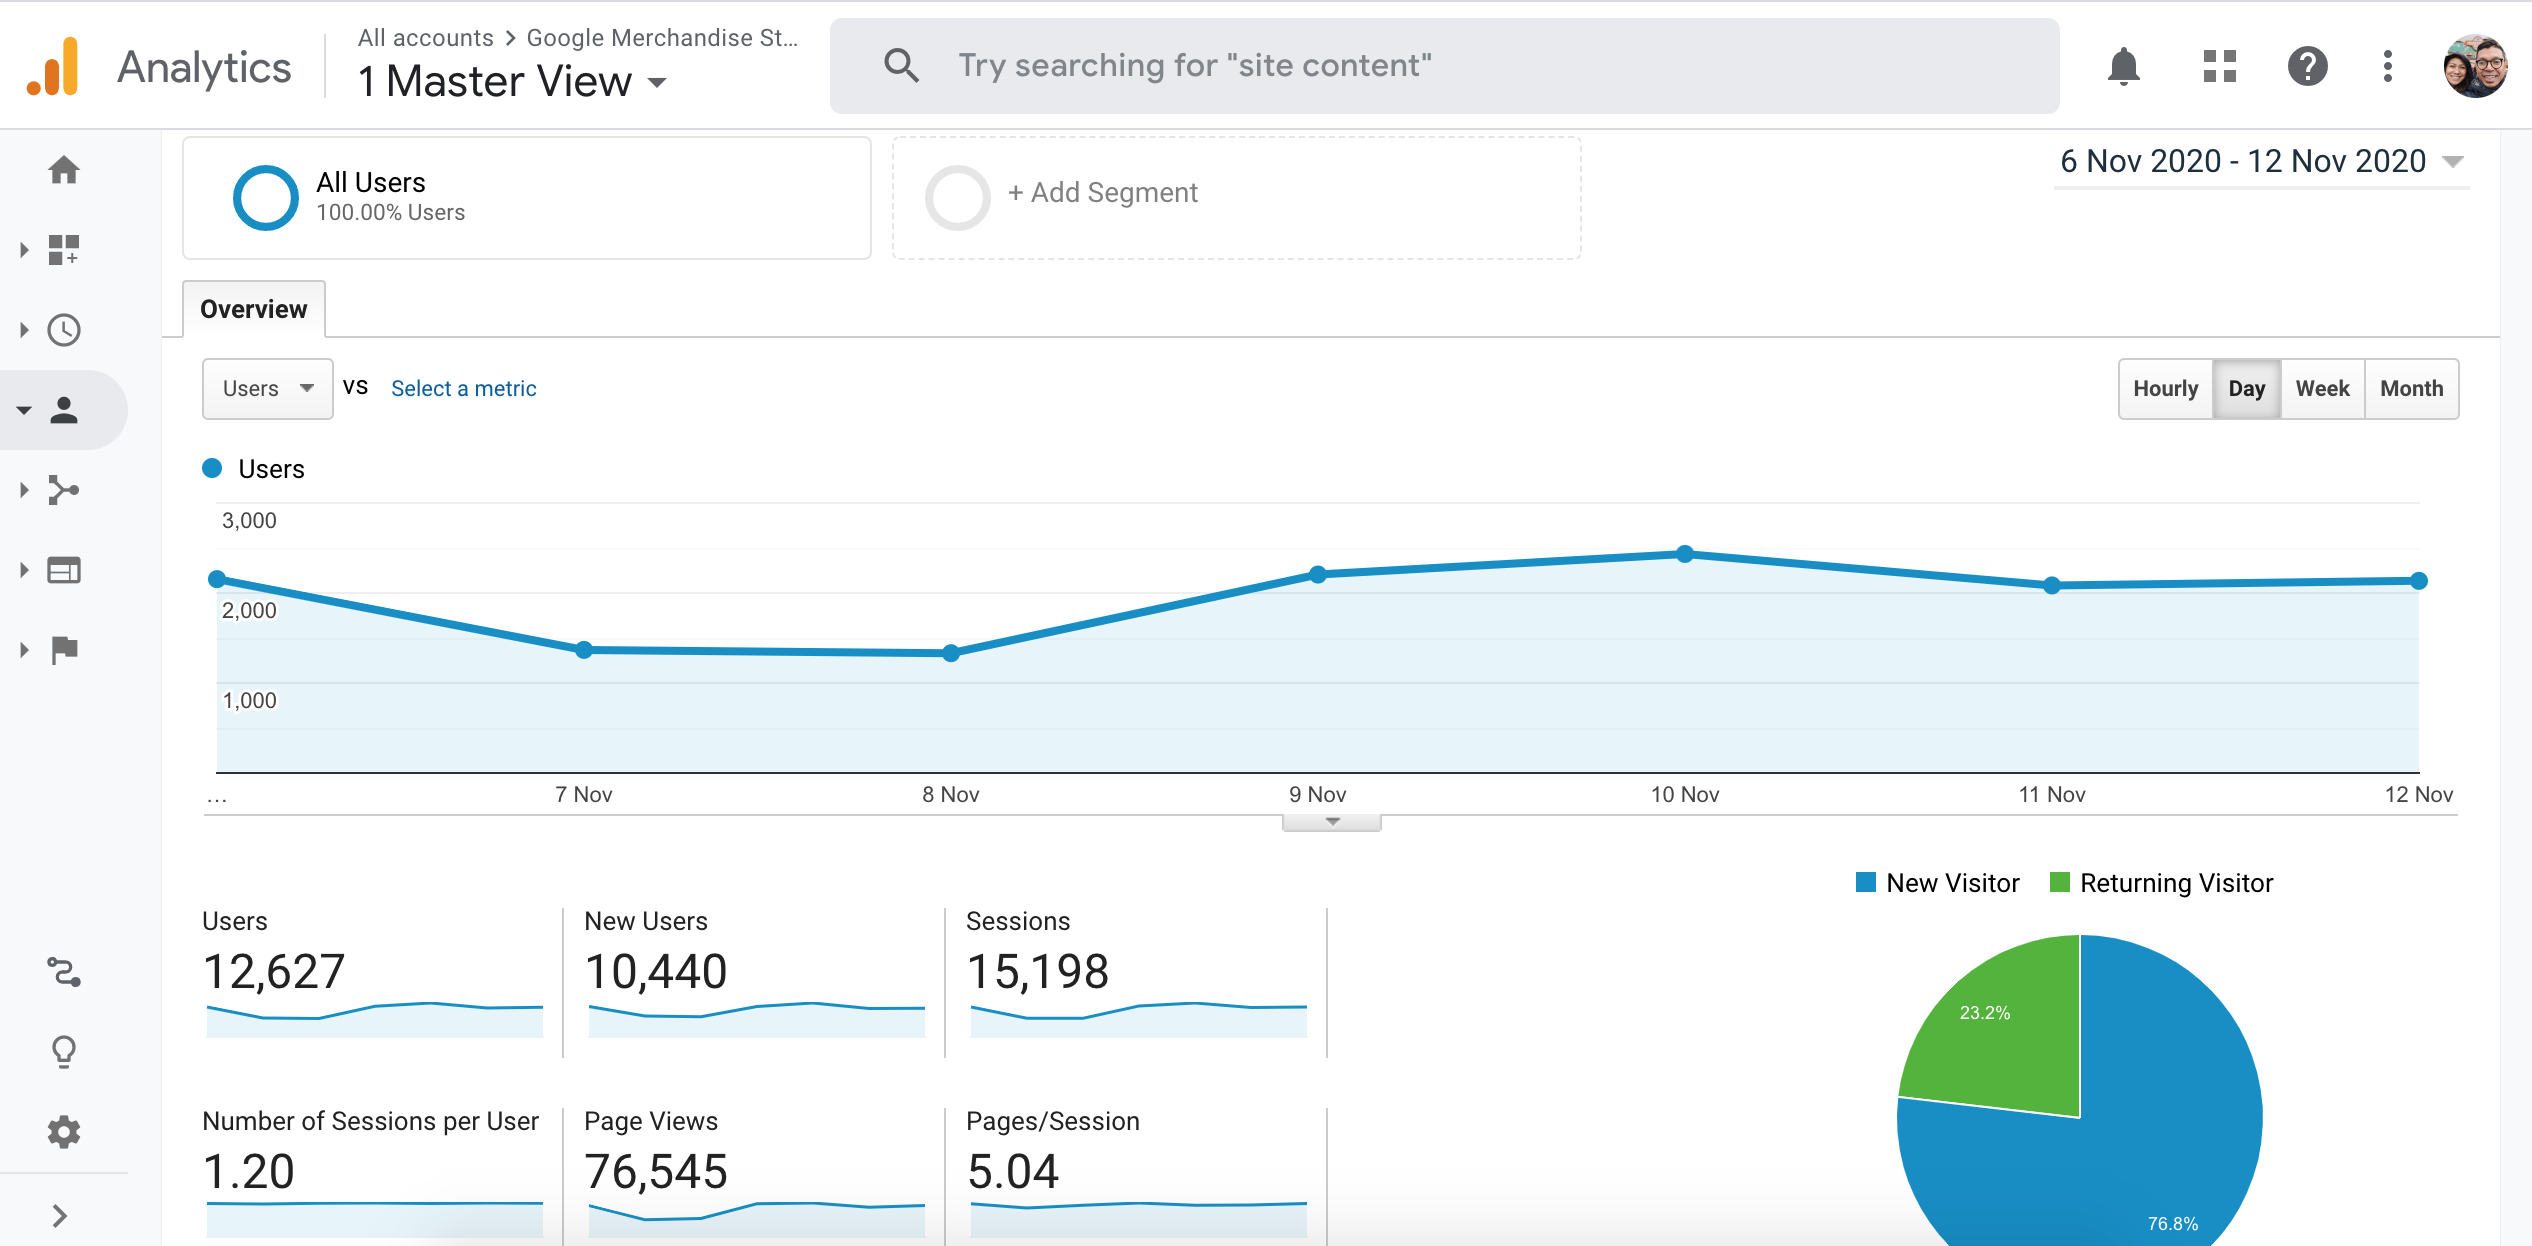
Web analytics is the process of analysing the behaviour of visitors to a web site. As a designer, there are many indicators that could point out an issue with a website. One of the most common indicators is to see when users visit and when they leave a site. This behavior tells which page a user usually lands on upon entering a site as well as which page experiences have highest drop-off. This information may indicate an issue.
Another indicator is what device is used to access the site. This allows the design team to analyse the type of commonly used devices to access the site as well as the screen size. With this, web designers can easily adapt to a mobile-first approach if the analytics data points out that majority of users are accessing the site from a mobile device.
The referring platform also plays a part in the web designer’s solution to a site. It indicates when a user lands on a site from social media, a search engine, or other sites. This then informs the design requirements to make the site SEO (search engine optimisation) friendly.
Social Media Analytics
Social media data represents a good approach to using qualitative and quantitative data to guide content creation and creative design. The indicators for social media analytics would be different from a web site. The four main indicators for social media analytics are audience interest, audience retention, audience intention, and audience conversion.
With audience interest, we are looking at insights, engagement, and awareness. This enables the designer or content creator to create user profile based on audience insights — inform types of content and format and indication to drive engagement.
Audience retention looks at landing page view, view through rate, and completion rate. It is an important metric to evaluate content appeal. It provides an indication on whether the content is designed for a specific audience and placement. On the other hand, audience intention measures the effectiveness of a campaign in driving audience intention to click, explore, and convert using video views, and link clicks metric.
Lastly, audience conversion is useful in recreating lookalike audience based on the best performing group of an audience as proved by the analytics. This is measured by app install, event response, and leads.
There are many more metrics and data that could be interpreted from an analytic. As a designer, it is increasingly crucial that we understand the metrics and are able to interpret data to further support and enhance our design output.